Lab 9 - Dashboard
Let’s conclude this workshop by looking at the Gloo Dashboard again and exploring it’s various features
-
Launch the dashboard:
# For localhost access you can use meshctl meshctl dashboard # if you run commands on remote station kubectl allows access to be more open kubectl port-forward -n gloo-mesh svc/gloo-mesh-ui 8090:8090 --address 0.0.0.0 -
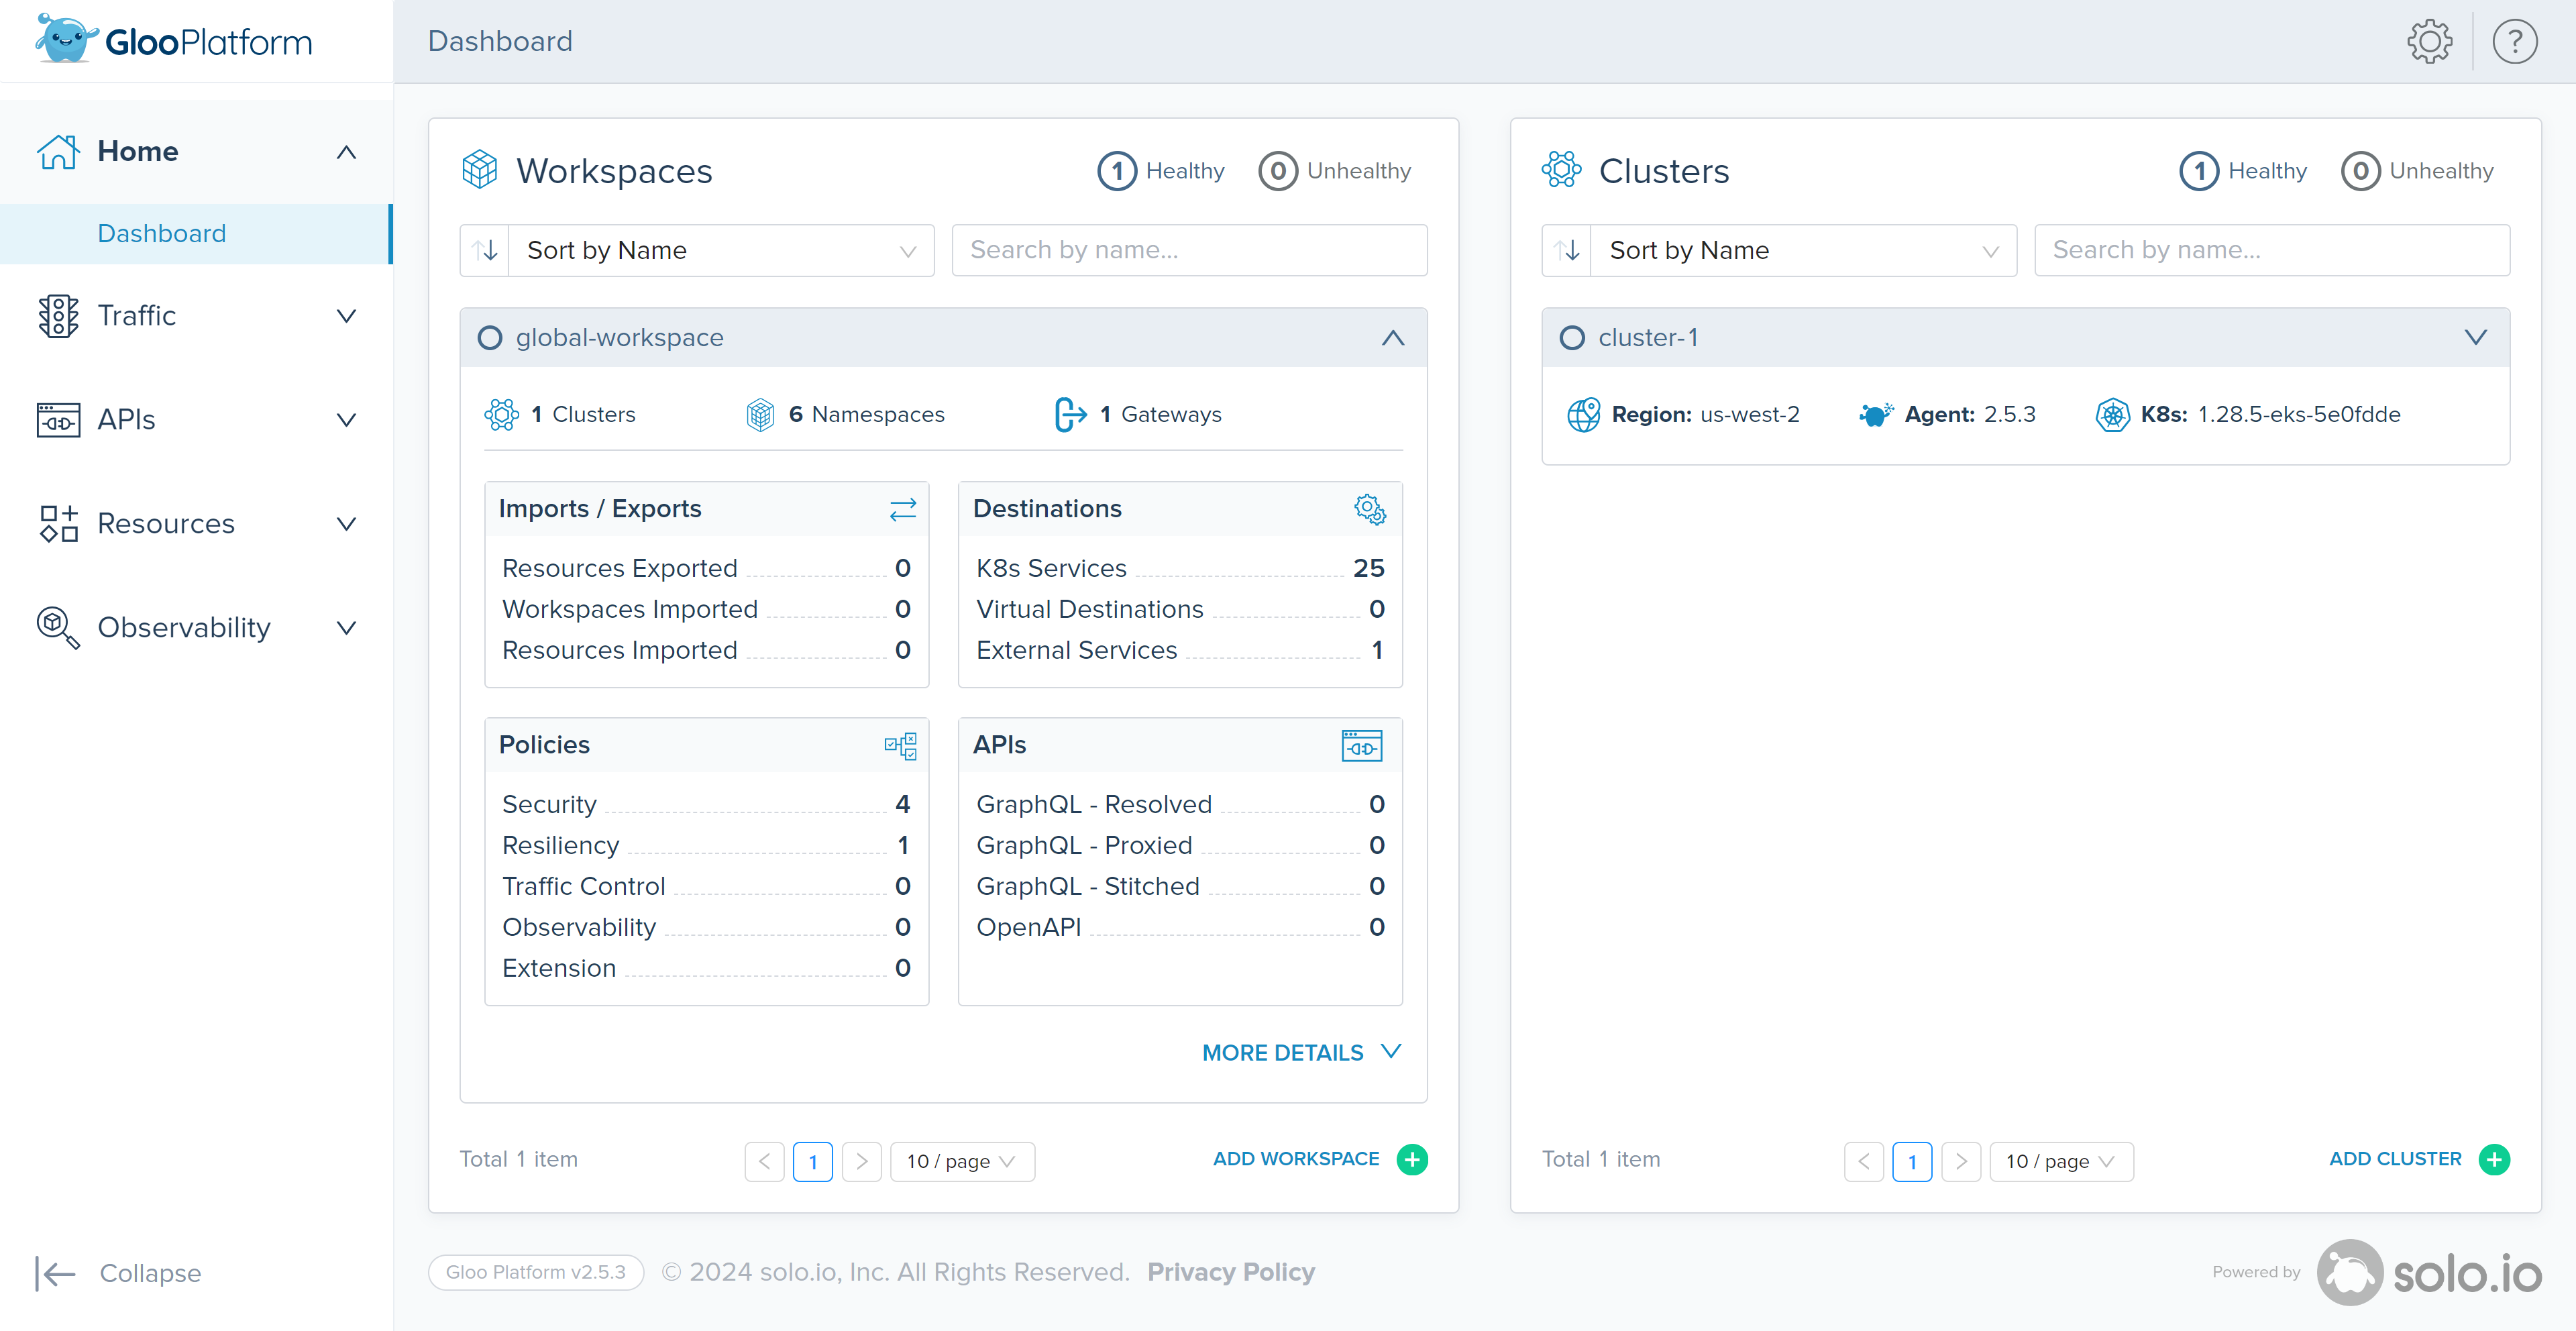
The homepage shows an at-a-glance look at the health of workspaces and clusters that make up your Gloo setup. In this workshop, we only used a single cluster and a single workspace, but Gloo Platform is intended to scale to multiple clusters and provide isolation between teams using Workspaces.
-
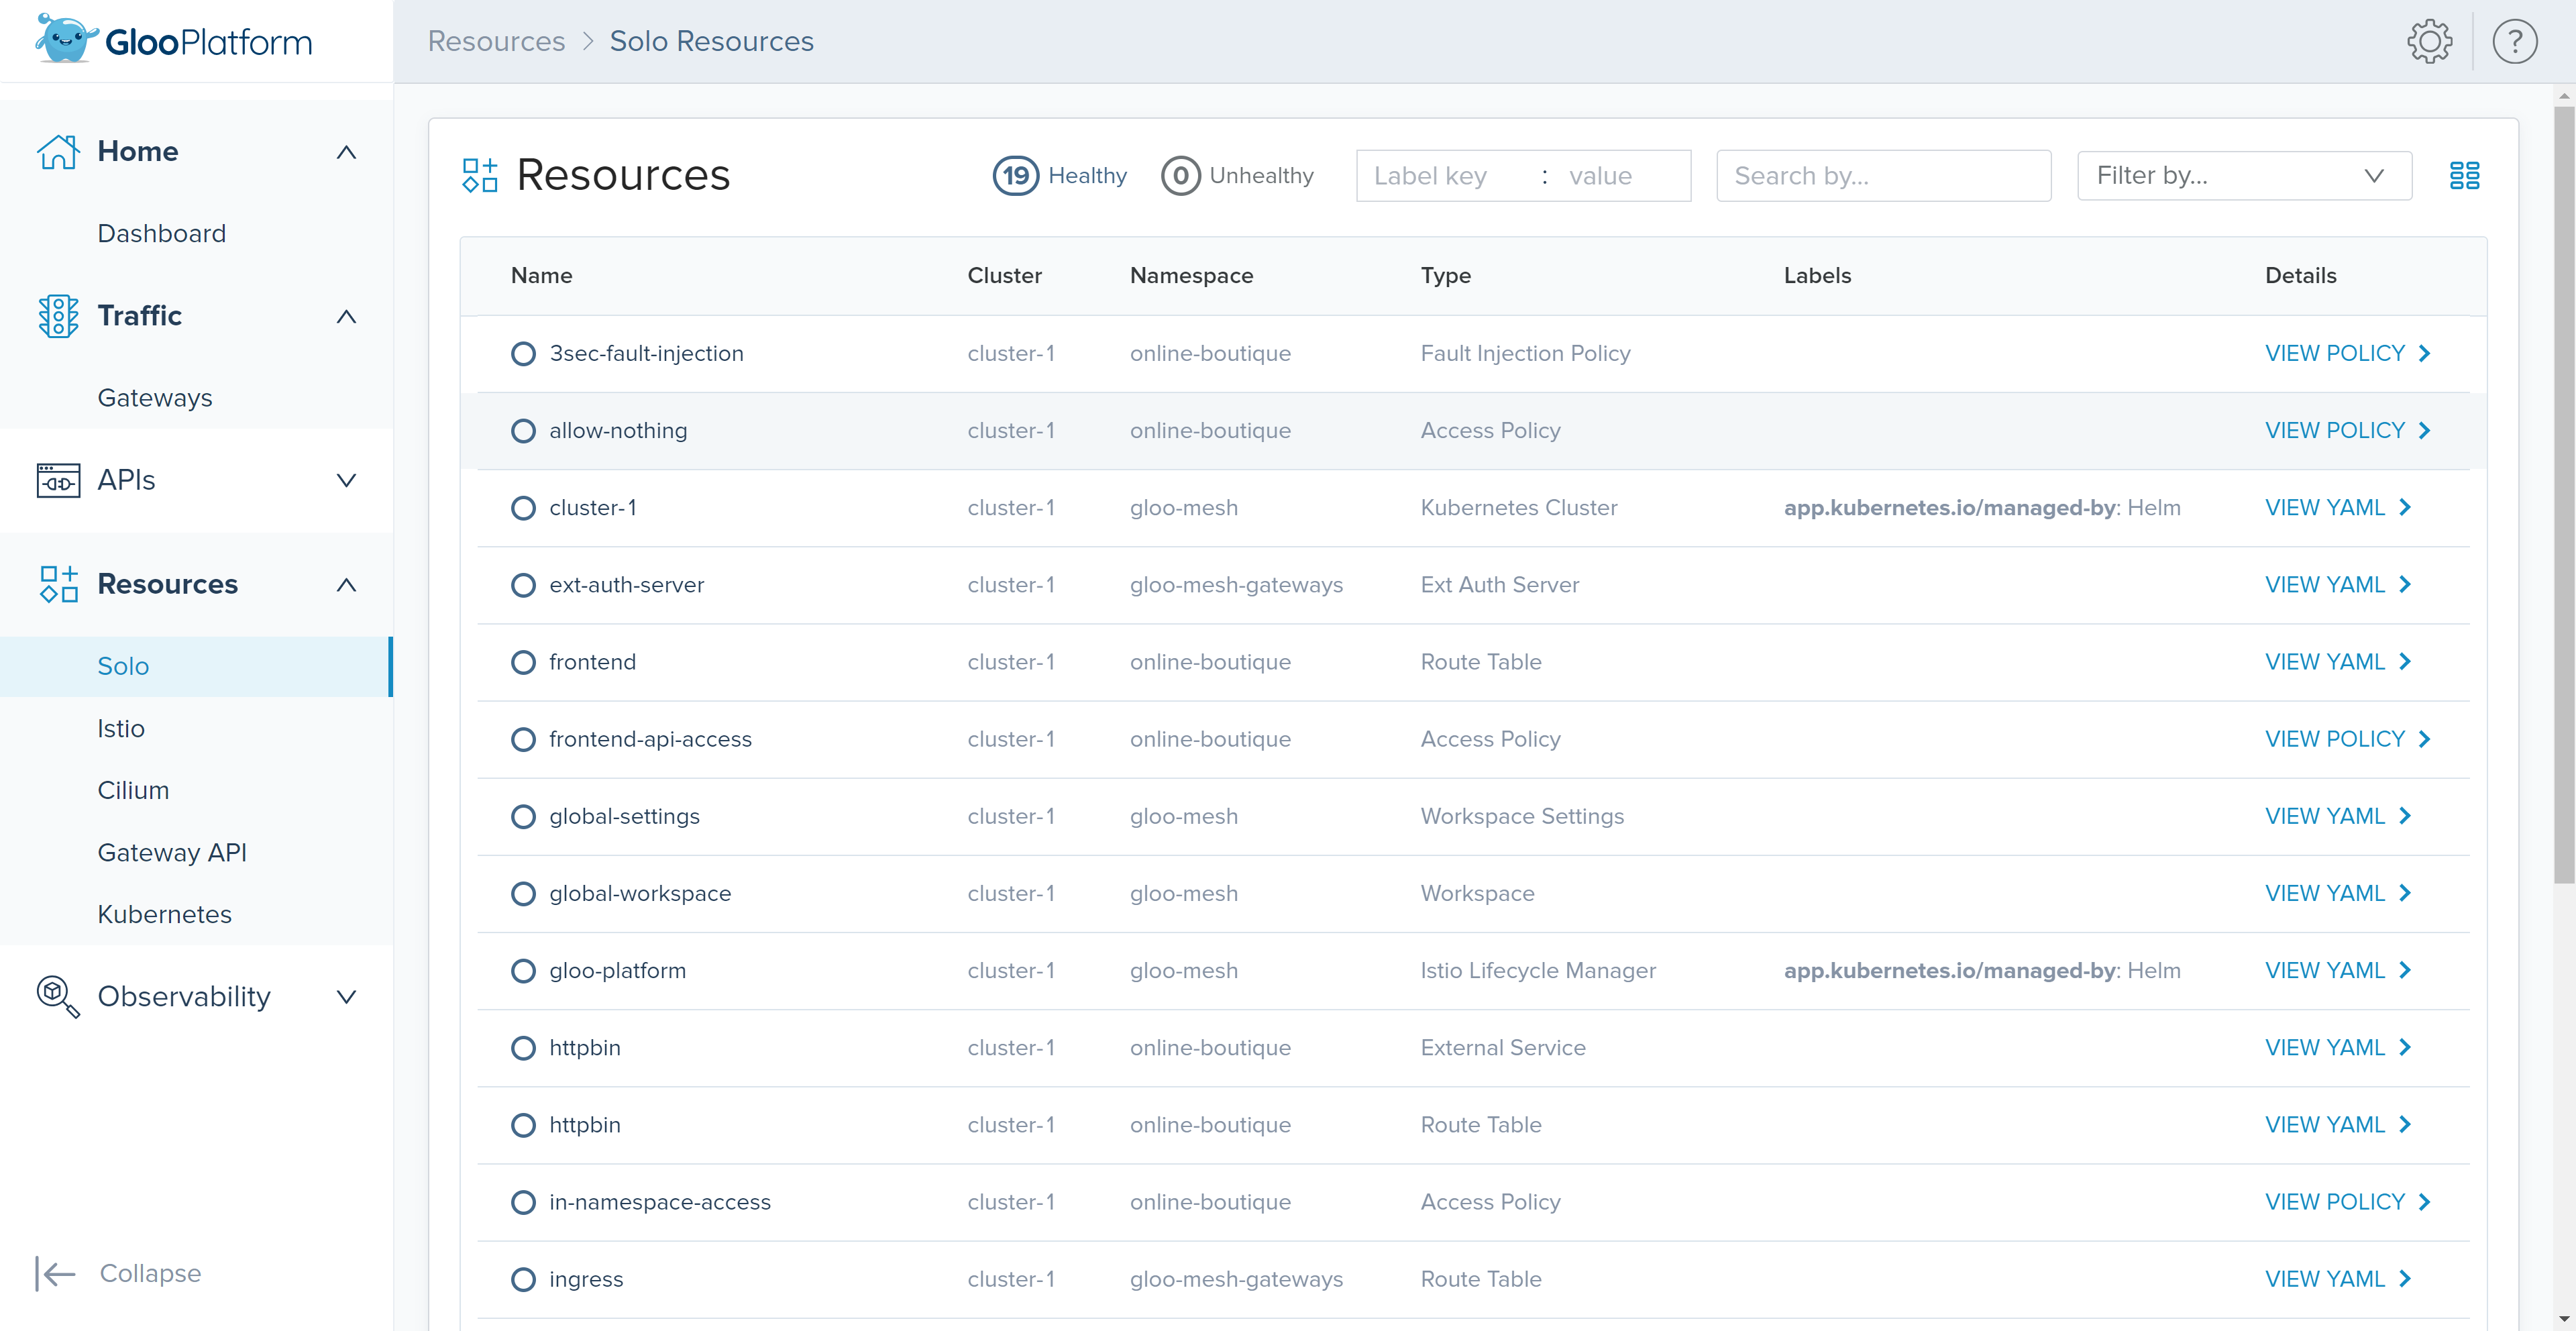
The ‘Solo’ page within the ‘Resources’ section provides a comprehensive view of various API objects, including Access and Traffic Policies, that we’ve defined during this workshop.”
-
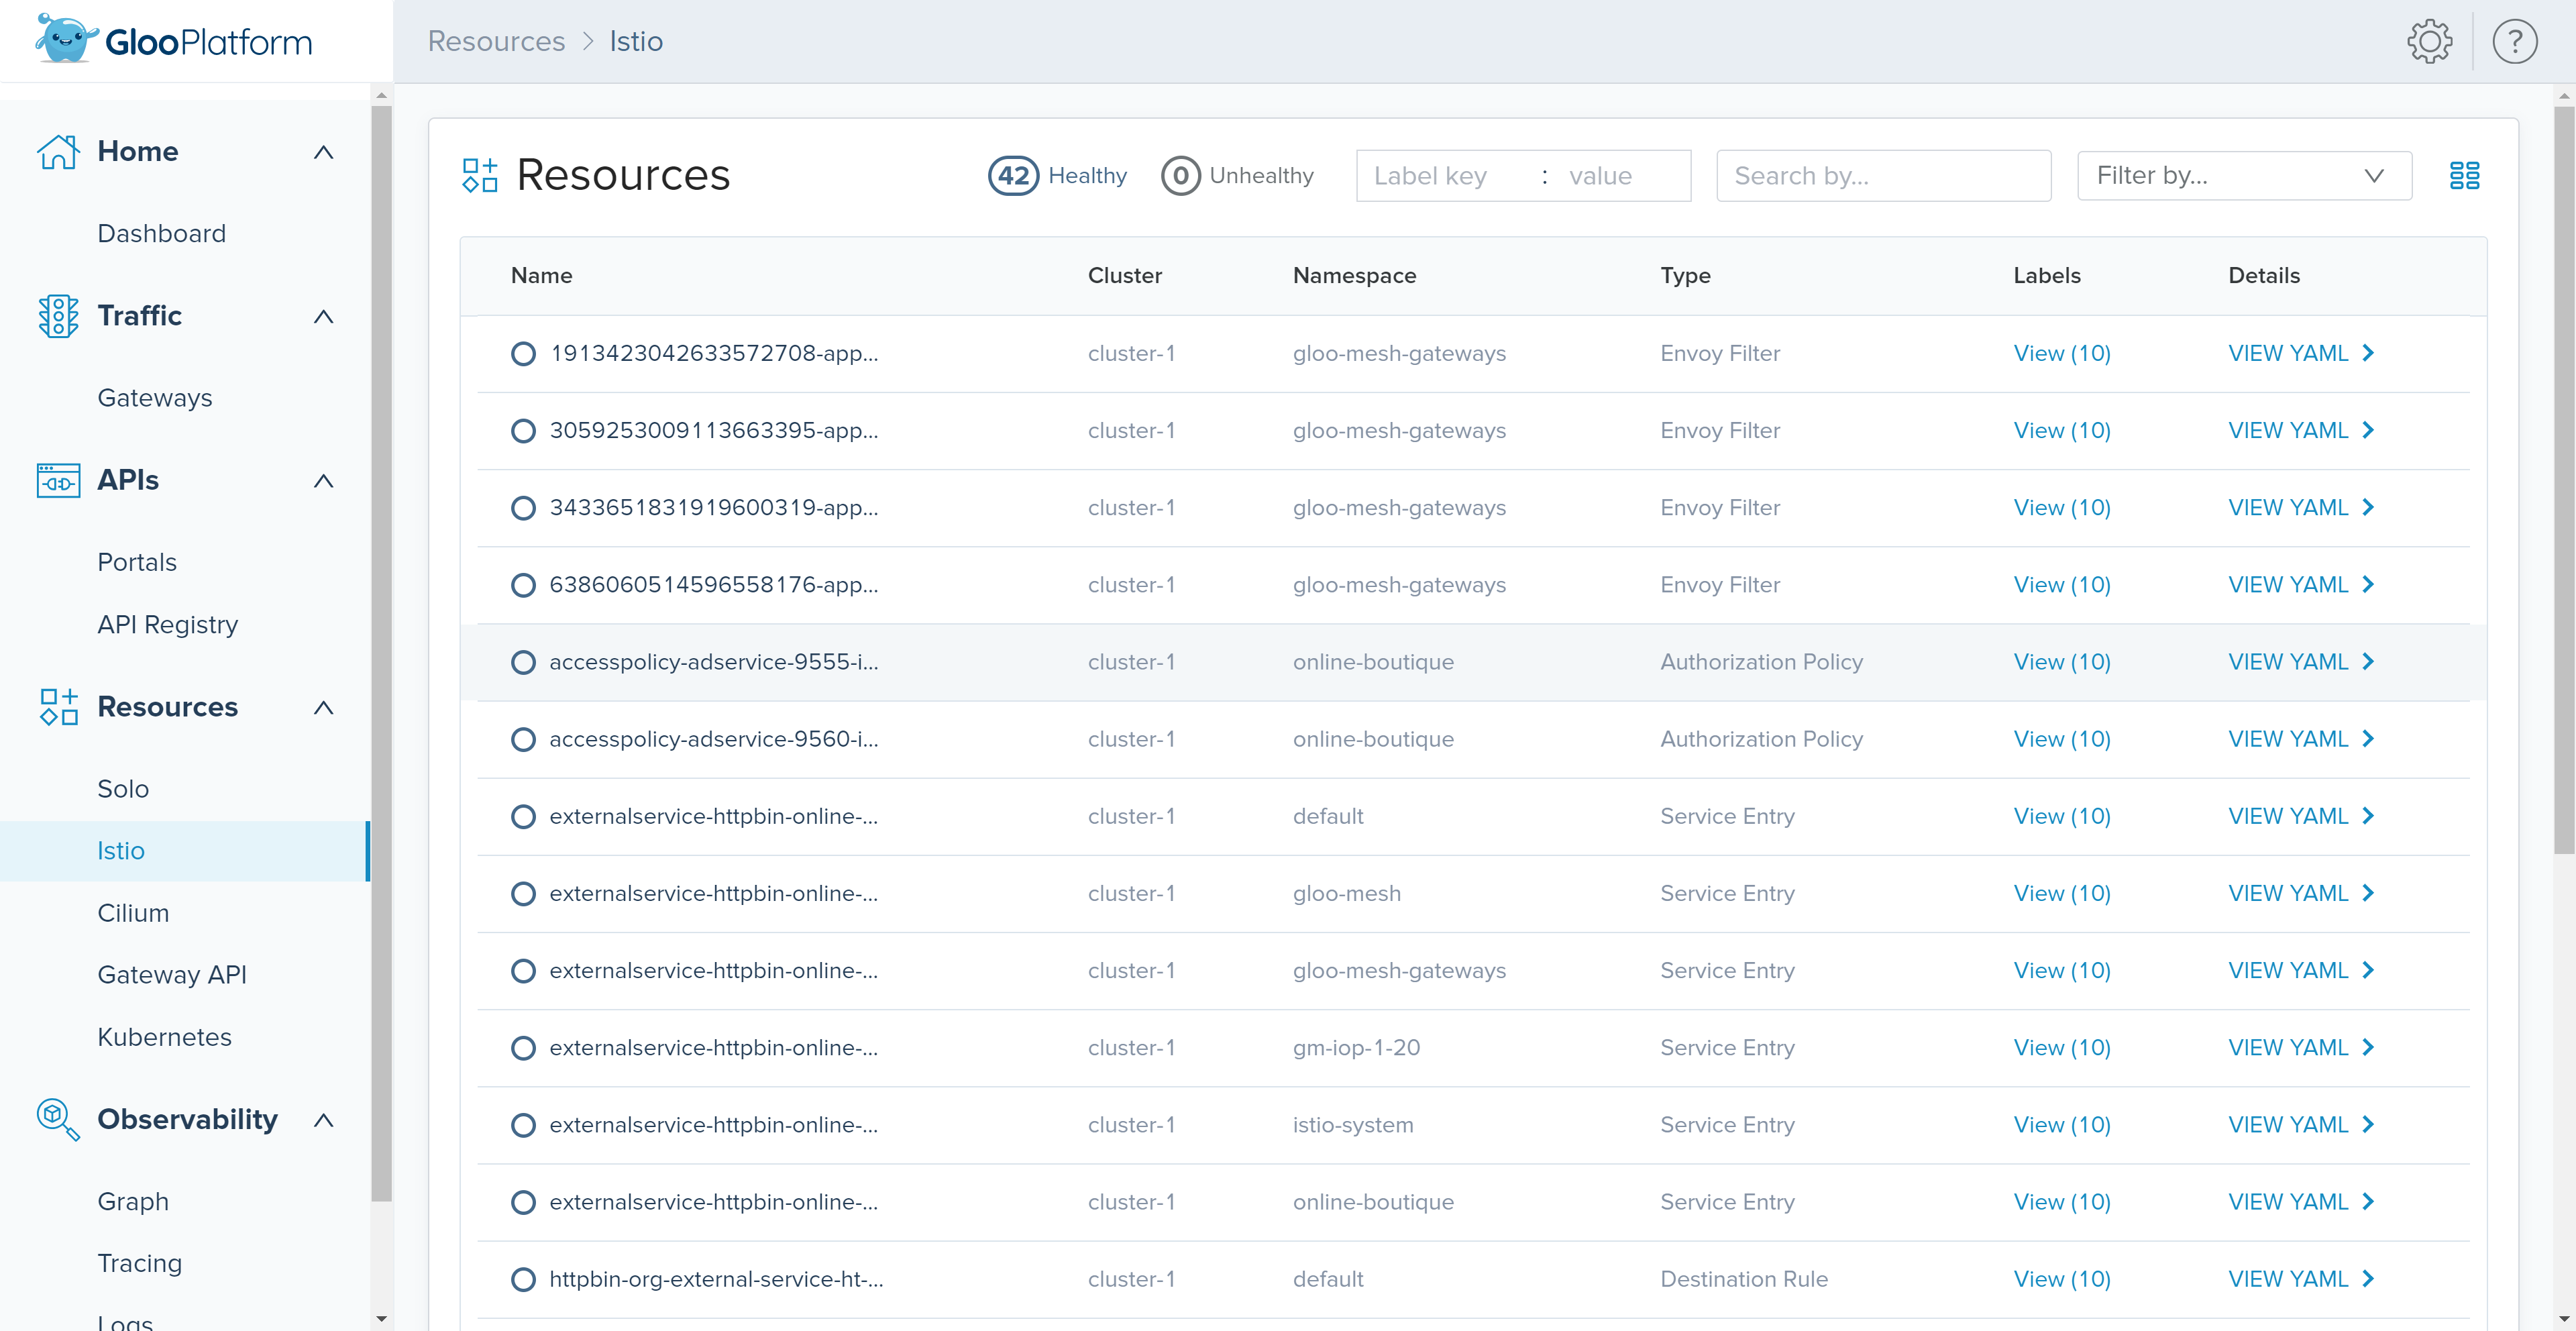
The ‘Istio’ sub-section within the ‘Resources’ section shows the Istio or Envoy configuration that was generated by Gloo. Review the configuration of translated Istio resources to help debug issues.
-
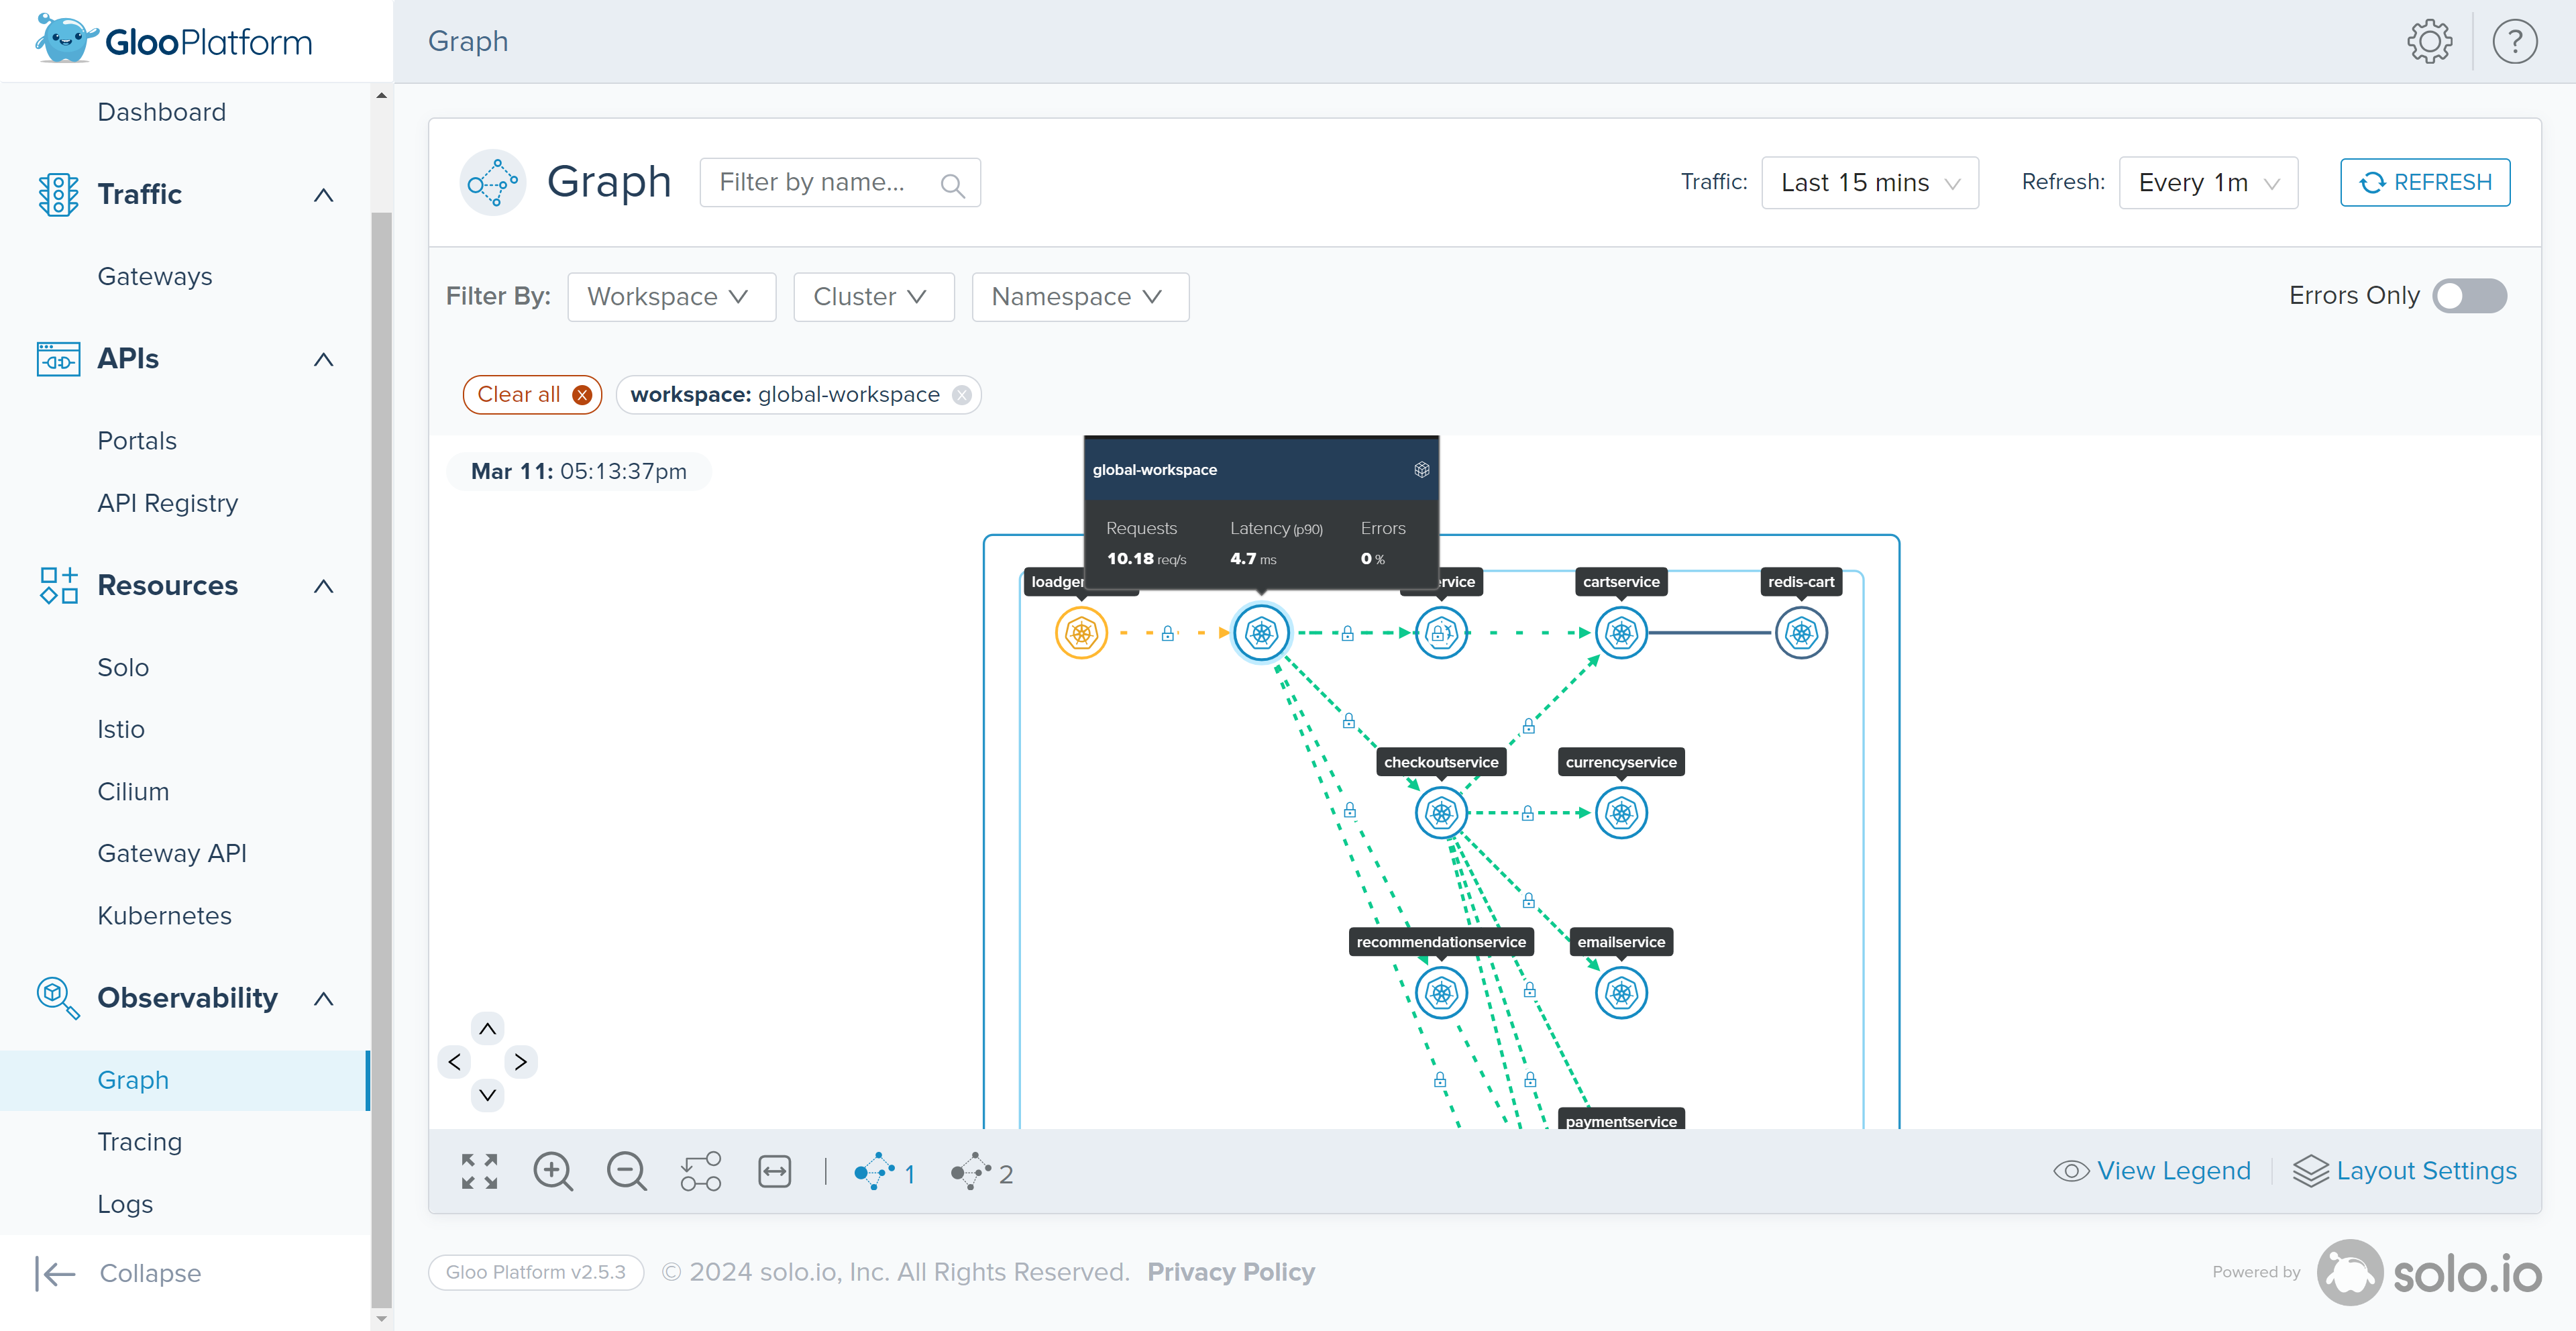
The Graph page within the ‘Observability’ section is used to visualize the network traffic that enters your cluster in a graph that maps out all the nodes by workspace (make sure “global-workspace” is selected), namespace, or cluster.
This lab, as the final chapter of our Gloo Platform EKS Workshop, brought everything together by showcasing the Gloo Dashboard, an integral component for monitoring and managing the Gloo environment. Through this lab, you’ve had the opportunity to explore various dashboard features, giving you insights into the health of workspaces and clusters, the policies we’ve implemented throughout the workshop, and valuable debugging and network traffic visualization tools.